"dcpam5" input/output NetCDF data based on Gtool4 NetCDF Conventions
Analysis and visualization tools for NetCDF data are need in order to analyze and visualize results of numerical experiments. Here, a GUI (Graphical User Interface) tool GAVE provided from Dennou Ruby Project is used. In addition, a CUI (Character User Interface) tool GPhys is provided there. Please select and use these tools for analysis and visualization.
It may be possible to analyze and visualize results of numerical experiments with some analysis and visualization tools (for example, GrADS, etc.) that can treat NetCDF data.
See Dennou Ruby Products Installation Guide.
Use ncdump command in order to refer information of output data. That command is included in NetCDF library, so the commend has been built and installed in process of installation of "dcpam5".
In order to refer information of "U.nc", input the command as follows. Contents are passed to pager "more" over pipe-line, since displayed lines are many.
$ ncdump -h U.nc | more
Contents are explained.
List of dimensional variables included in the data file. Numerical value is number of data of the dimensional variables.
netcdf U {
dimensions:
        lon = 64 ;
        lat = 32 ;
        sig = 20 ;
        sigm = 21 ;
        time = UNLIMITED ; // (11 currently)
Metadata of dimensional and dependent variables included in the data file. 'float' indicates that the data is single precision real. If the data is double precision or integer, the character is changed to 'double' or 'int'. Variable(dimensional variables depended) is displayed at the back of it.
variables:
        float lon(lon) ;
                lon:long_name = "longitude" ;
                lon:units = "degree_east" ;
                lon:standard_name = "longitude" ;
                lon:gt_calc_weight = "lon_weight" ;
                      :
        float time(time) ;
                time:long_name = "time" ;
                time:units = "day" ;
                      :
        float U(time, sig, lat, lon) ;
                U:long_name = "eastward wind" ;
                U:units = "m s-1" ;
Global attirbutes appended to whole of the data file. Conventions of the file, title, source of data, created date and time, etc. are registered.
// global attributes:
                :Conventions = "http://www.gfd-dennou.org/library/gtool4/conventions/" ;
                :gt_version = "4.3" ;
                :title = "Held and Suarez (1994) benchmark test ..." ;
                :source = "dcpam5 (http://www.gfd-dennou.org/library/dcpam)" ;
                :institution = "GFD Dennou Club (http://www.gfd-dennou.org)" ;
                :history = "2008-11-29T22:01:10+09:00 unknown> gtool_history: HistoryCreate\n",
                        "" ;
}
In order to refer data, input the command as follows.
$ ncdump Temp.nc | more
The data is displayed as follows.
data:

 lon = 0, 5.625, 11.25, 16.875, 22.5, 28.125, 33.75, 39.375, 45, 50.625,
    56.25, 61.875, 67.5, 73.125, 78.75, 84.375, 90, 95.625, 101.25, 106.875,
    112.5, 118.125, 123.75, 129.375, 135, ...

 lat = -85.76059, -80.26878, -74.74454, -69.21297, -63.67863, -58.14296,
    -52.60653, -47.06964, -41.53246, -35.99508, -30.45755, -24.91993,
    -19.38223, -13.84448, -8.306703, ...

                        :

 Temp =
  249.9899, 249.9622, 249.9368, 249.9154, 249.8999, 249.8913, 249.8905,
    249.8973, 249.9113, 249.9315, 249.9562, 249.9835, 250.0113, 250.0375,
    250.0599, 250.0769, 250.0871, 250.0898, 250.0847, 250.0722, 250.0533,
    250.0295, 250.0026, 249.9747, 249.948, 249.9245, 249.9062, 249.8943,
    249.8899, 249.8932, 249.9041, 249.9217,
  249.9899, 249.9658, 249.9432, 249.9233, 249.9073, 249.8962, 249.8905,
    249.8907, 249.8967, 249.9081, 249.9244, 249.9445, 249.9672, 249.9913,
    250.0153, 250.0378, 250.0575, 250.0732, 250.084, 250.0894, 250.0889,
    250.0825, 250.0708, 250.0543, 250.034, 250.0112, 249.987, 249.9631,
    249.9407, 249.9212, 249.9058, 249.8952,
Some data is visualized. A method of visualization with "GAVE" are showed as follows. Firstly, run "gave".
$ gave
Following window will be displayed.

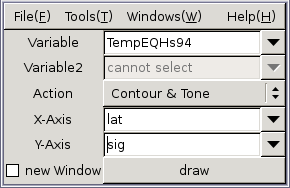
Select a data file by [File] -> [Open] . Select "TempEQHs94.nc" here. This is equilibrium temperature used in Newtonian relaxation proposed by Held and Suarez (1994). After the file is opended, set values as follows, and click [draw].
Following window will be displayed. The figure indicates that temperature is 300 K or more on surface and the equator, and it is decreased as longitude increased and altitude increases.
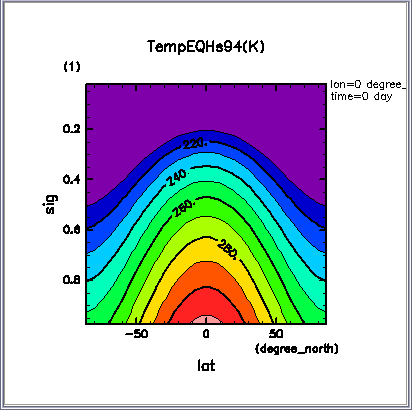
Select a data file by [File] -> [Open] . Select "TempEQHs94.nc" here. This is equilibrium temperature used in Newtonian relaxation proposed by Held and Suarez (1994). After the file is opended, set as follows, and click [draw].
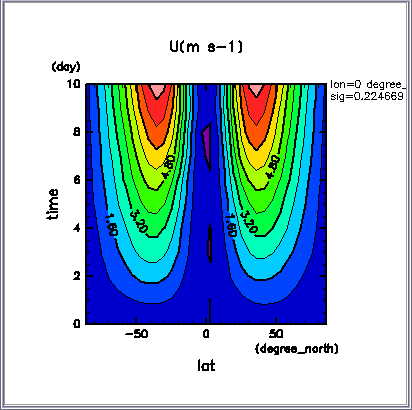
Next, see changes of eastward wind. Load 'U.nc' by [File] -> [Open] . In this time, set values as follows, and click [draw].
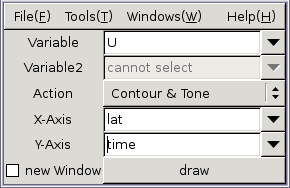
Following window will be displayed. This is eastward wind in a layer nearest to the surface. The figure indicates that velocity is 0 m/s at initial fields, and westward wind is arose at the equator and mid-latitude gradually.
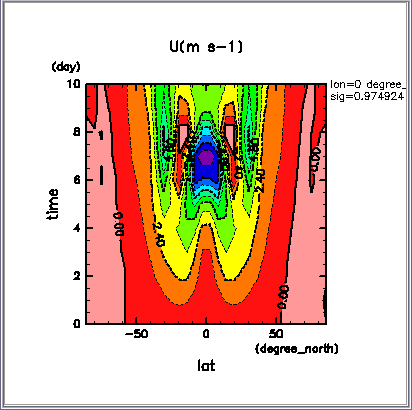
At last, see changes of eastward wind in midair. Display a window that sets dimension by [Tools] -> [Dimensions]. On the windows set [sig] to about 0.2, and click [draw].

Following window will be displayed. This is eastward wind in a layer at about 200 hPa. The figure indicates that velocity is 0 m/s at initial fields, and eastward wind is arose at +/- 40 deg. latitude gradually.
